Choo-Yuen Ting1,2,
Ahmad Fuad Shamsuddin3,
Kian-Meng Chang2,
Mohd Makmor-Bakry1,
Norazrina Azmi1 ![]()
For correspondence:- Norazrina Azmi Email: azrina.azmi@ukm.edu.my Tel:+60392897095
Received: 14 June 2016 Accepted: 7 February 2017 Published: 31 March 2017
Citation: Ting C, Shamsuddin AF, Chang K, Makmor-Bakry M, Azmi N. Quantification of BCR-ABL transcripts in peripheral blood cells and plasma of chronic myeloid leukemia patients at different stages of tyrosine kinase inhibitor treatment response. Trop J Pharm Res 2017; 16(3):657-663 doi: 10.4314/tjpr.v16i3.22
© 2017 The authors.
This is an Open Access article that uses a funding model which does not charge readers or their institutions for access and distributed under the terms of the Creative Commons Attribution License (http://creativecommons.org/licenses/by/4.0) and the Budapest Open Access Initiative (http://www.budapestopenaccessinitiative.org/read), which permit unrestricted use, distribution, and reproduction in any medium, provided the original work is properly credited..
Purpose: To investigate the feasibility of using peripheral blood plasma samples as surrogates for blood cell sampling for quantification of breakpoint cluster region-Abelson oncogene (BCR-ABL) transcript levels to monitor treatment responses in chronic myeloid leukemia (CML) patients.
Methods: Peripheral blood samples were collected from 20 healthy individuals and 165 CML patients at various stages of treatment response. Level of BCR-ABL mutation gene transcripts were determined by RNA extraction and quantitative real time polymerase chain reaction (RT-PCR).
Results: The ratio of BCR-ABL transcripts/ABL transcripts in blood cells was significantly higher (p < 0.05) than in plasma for untreated and treated patients. Patients who received tyrosine kinase inhibitor (TKI) therapy and achieved major molecular response during treatment had the lowest mean ratio detected in blood cells (0.06 ± 0.0 %) and the ratio was below the detectable limit in plasma samples. Unlike plasma samples, BCR-ABL/ABL transcript ratios in blood cell samples strongly correlated with white cell counts in CML patients undergoing all types of treatment responses.
Conclusion: Blood cell sampling is more sensitive than plasma sampling in diagnosis and evaluation of CML treatment response
Introduction
Chronic myeloid leukemia (CML) is a proliferative clonal disorder that occurs due to reciprocal translocation between chromosome 9 and chromosome 22 and forms the “Philadelphia Chromosome” (PC). The fusion gene, breakpoint cluster region-Abelson oncogene (BCR-ABL), is formed as a result of reciprocal translocation of ABL gene from chromosome 9 onto the BCR gene on chromosome 22 [1]. BCL-ABL gene causes dysregulated tyrosine kinase activity and consequently results in uncontrolled malignant BCR-ABL cell proliferation and cell resistance to apoptosis [2].
Prior to the introduction of tyrosine kinase inhibitors (TKIs), the main drugs used to treat CML were busulphan, hydroxyurea and interferon-alpha, which do not selectively target BCR-ABL cells. The various types of adverse reactions caused by these non-targeted molecular drugs have led to their replacement with TKI therapy. TKI drugs, such as imatinib mesylate, are targeted molecular therapies used to treat CML. TKI therapy induces BCR-ABL cell death through various mechanisms, which include necrosis-like cell death mediated by Omi/HtrA2 intermembrane protein; downregulation of the level of antiapoptotic proteins XIAP, cIAP1, and Bcl-x(L); caspase-independent apoptosis; and programmed cell death [3]. Tyrosine kinase inhibitors have dramatically improved the life span and the quality of life of CML patients.
The discovery of PC in CML patients in the 1960s promoted the use of molecular cytogenetic as an important tool for diagnosing CML. The development of fluorescent in situ hybridization technique in addition to cytogenetic analysis enabled high-resolution methods to detect the PC fusion signal pattern for assessing complete cytogenetic response. Advanced real-time polymerase chain reaction was eventually applied for quantification of BCR-ABL transcripts and was found to be feasible for minimal residual disease monitoring in CML patients [4].
In current practice, peripheral blood cells have largely replaced the use of bone marrow cells for gene expression testing to monitor treatment response and detecting disease relapse among CML patients. The use of peripheral blood for analysis is preferred over bone marrow sampling as it is a minimally invasive and simpler procedure. A drawback of using peripheral blood comes from the low white blood cell count among patients receiving TKI, which may result in poor RNA quality and consequently give false low BCR-ABL transcript concentrations, especially in patients who have achieved major molecular response [5].
Numerous studies indicate that nucleic acids in plasma could serve as useful biomolecules for diagnosing cancer as well as for evaluating the efficacy of treatment [6]. The mechanism and origin of plasma nucleic acids have yet to be completely discovered; however, administration of anticancer drugs has been shown to be strongly associated with cancer cell death and release of nucleic acids into plasma [7], leading to the suggestion of using plasma nucleic acids for routine cancer diagnostic work.
Molecular diagnostic tests conducted on nucleic acids in plasma samples are not only confined to patients with solid localized tumors, but also those with hematological malignancies such as chronic lymphocytic leukemia and myeloproliferative disease [8].
Therefore, the diagnostic value of plasma RNA for quantification of BCR-ABL transcripts was evaluated in this study. We quantified BCR-ABL transcript levels in blood cell RNA samples and plasma RNA samples of CML patients at various stages of treatment response and compared their transcript levels to those found in healthy individuals.
Methods
Study subjects
This research was conducted in accordance with the International Ethical Guidelines for Biomedical Research Involving Human Subjects [9]. The protocol was reviewed and approved by the Medical Review & Ethics Committee (MREC), Ministry of Health Malaysia (NMRR ID: NMRR-10-645-5895). This study was a prospective study of CML adult patients seen at the Hematology Clinic of Ampang Hospital, the national referral center for hematological malignancies in Malaysia. A total of 165 CML patients comprised of both genders, three main races in Malaysia, and spanning all adult ages were recruited through voluntary participation.
CML patients on anticancer drugs other than TKIs were excluded from this study. Control blood samples were obtained from 20 healthy blood donors from the National Blood Bank, Kuala Lumpur, Malaysia. All CML patients and healthy individuals provided written informed consent for use of their samples in this research. Patient information, such as age, ethnicity, drug regimen, disease status, treatment duration and treatment response, was collected by retrospective review of clinical case notes. The disease status of CML patients was categorized according to the European Leukemia Net [10].
RNA extraction procedure
Peripheral blood samples of study subjects were collected in ethylenediaminetetraacetate (EDTA) tubes. Plasma was separated from blood cells by centrifugation at 1200 x g for 10 minutes. RNA was extracted from approximately 7 × 10⁶ cells; and a volume of 2 mL of plasma fraction was aliquoted for plasma RNA extraction. RNA extraction of blood cell and plasma samples was conducted as described in a previous study [11].
Determination of RNA sample quality and quantity
RNA sample quality (A260/280) and purity and (A260/230), as well as RNA concentration were determined using a Nanodrop spectrophotometer (Thermo Scientific). RNA samples were stored at -80 ˚C for BCR-ABL gene quantification.
Quantification of BCR-ABL to ABL ratio using real time-polymerase chain reaction
RT-PCR experiments were carried out on a Rotor-Gene 6000 instrument and the Rotor-Gene Q series software (Qiagen) was used for analyzing the quantification of BCR-ABL gene and ABL gene expression. PCR was performed using Molecular MD’s One-step qRT-PCR BCR-ABL kit (Portland, OR, USA).The target gene was BCR-ABL whereas ABL was used as reference gene. The technique was based on the TaqMan® MGB® probe technology. Paired plasma and cell samples were analyzed concurrently on the system. Gene specific primers, probes, and internal quality controls were provided in the Molecular MD’s One-step qRT-PCR BCR-ABL kit (Portland, OR, USA).
PCR experiments were performed according to a previously described methodology [11]. Briefly, for each 25 µL reaction, PCR amplification was performed using 1 μL of primer/probe set, 100 ng to 250 ng of genomic RNA (5 µL), 12.5 μL 2X Reaction Mix (a buffer containing 6mM MgSO4 and 0.4 mM each of dNTP), 0.5 μL Invitrogen SuperScript lll/Platinum Taq Enzyme Mix, 0.5 μL of RNaseOUT Recombinant Ribonuclease Inhibitor, and 5.5 μL of PCR-grade dH2O. The PCR protocol applied was50°C for 15 min (1 cycle); 95°C for 2 min (1 cycle); 95 °C for 15 sec and 60 °C for 60 sec Acquisition Green channel for 42 cycles.
BCR-ABL gene standard curve was plotted based on 6 different concentrations of the BCR-ABL gene, namely 300,000 copies/5 µL of BCR-ABL gene, 30,000 copies/5 µL of BCR-ABL gene, 3,000 copies/5 µL of BCR-ABL gene, 300 copies/5 µL of BCR-ABL gene, 30 copies/5 µL of BCR-ABL gene and 3 copies/5 µL of BCR-ABL gene. For the ABL gene standard curve, 6 different concentrations of ABL gene were used, namely 300,000 copies/5 µL of ABL gene, 30,000 copies/5 µL of ABL gene, 3,000 copies/5 µL of ABL gene, 300 copies/5 µL of ABL gene, 30 copies/5 µL of ABL gene and 3 copies/5 µL of ABL gene. The test results were expressed in BCR-ABL/ABL transcript ratios to allow direct comparison between blood cell and plasma values.
Statistical analysis
BCR-ABL/ABL transcript ratio was expressed as mean ± standard deviation (SD). Paired sample t-test was used to determine significant differences between matched plasma and cell samples. Differences between treatment response groups were analyzed using oneway ANOVA followed by Tukey’s post-hoc test with p < 0.05 considered significant. The Pearson bivariate correlation coefficient was utilized to measure the strength of relationship between white blood cell counts and BCR-ABL /ABL transcript ratios.
Results
Quality and quantity of extracted RNA
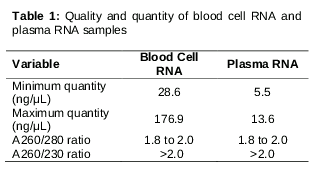
As shown in , RNA extracted from plasma samples ranged from 5.5 ng/µL to 13.6 ng/µL, whereas the quantity of RNA extracted from blood cell samples was much higher, ranging from 28.6 to 176.9 ng/µL. RNA samples extracted from blood cell samples and plasma samples were pure, free from contamination (phenol and sodium chloride salt), with A260/280 ratio ranging from 1.8 to 2.0 and A260/230 ratio greater than 2.0. The inter-assay coefficient of variation of real time polymerase chain reaction assay was 23.9 ± 2.2 %.
BCR-ABL/ABL transcript ratios at various stages of treatment response
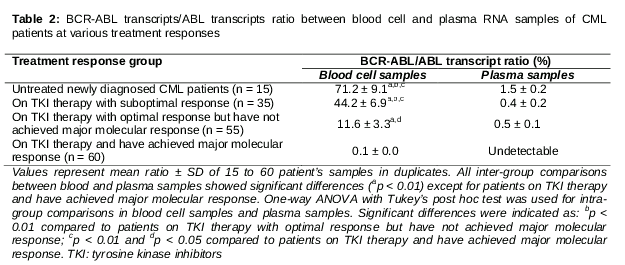
As shown in , all treatment response groups showed concordant results whereby BCR-ABL gene was detected successfully in both blood cell samples and plasma samples except for the fourth group: the CML patients receiving TKI therapy and who have achieved major molecular responses. For this particular treatment response group, BCR-ABL/ABL transcript was detected in blood cell samples (mean ratio was 0.1 ± 0.0 %) only, not in plasma samples (mean ratio was 0.0 %). In addition, paired t-test indicated that the mean BCR-ABL/ABL transcript ratio was significantly higher (p < 0.01) in blood cell samples compared to in plasma samples for all treatment response groups, except in CML patients who have achieved major molecular response.
In blood cell samples, untreated newly diagnosed CML patients had the highest level of BCR-ABL/ABL transcript ratios (mean ratio was 71.2 ± 9.1 %), whereas CML patients receiving TKI therapy and who have achieved major molecular responses showed the lowest BCR-ABL/ABL transcript ratio (mean ratio was 0.1 ± 0.0 %). The one way ANOVA and Tukey’s post hoc test demonstrated that in blood cell samples, mean BCR-ABL/ABL transcript ratios of CML patients who have achieved major molecular responses were statistically different (p < 0.01) compared to in newly diagnosed untreated CML patients, CML patients with suboptimal responses (p < 0.01), and patients with optimal treatment responses but have not achieved major molecular responses (p < 0.05). In contrast, in plasma samples, there were no significant differences (p > 0.05) in BCR-ABL/ABL transcript ratios among all treatment response groups.
Correlation between BCR-ABL/ABL transcript ratio and white blood cell count values
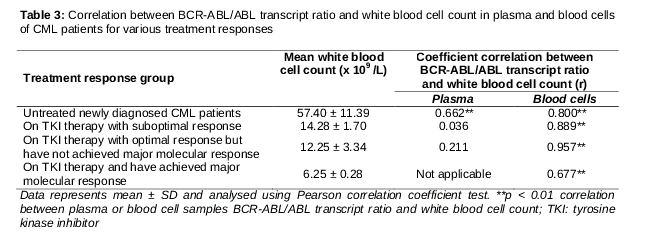
Pearson’s bivariate correlation analysis indicated significant positive correlation (p < 0.01) between BCR-ABL/ABL transcript ratios in blood cell samples and their respective white blood cell count values (). All treatment response groups for blood cell samples showed strong positive correlation between BCR-ABL/ABL transcript ratios and respective white blood cell counts (r = 0.800 for untreated newly diagnosed CML patients, r = 0.889 for CML patients on TKI therapy and with suboptimal response, r = 0.957 for CML patients on TKI therapy and with optimal response but who have not achieved major molecular response, and r = 0.677 for CML patients on TKI therapy and who have achieved major molecular response). As for plasma samples, only the untreated newly diagnosed CML patients group demonstrated positive correlation (r = 0.662) with white blood cell count values. The remaining three groups demonstrated weak correlation with respect to white blood cell count values.
Discussion
Numerous studies have shown promising results of using free-circulating plasma nucleic acids instead of peripheral blood cells for testing gene expression.. However, the levels of disease-associated mutated genes are rather low in plasma RNA samples [12]. Similarly, our results revealed that though the concordance rate of BCR-ABL transcript detection between plasma RNA and blood cell RNA was 63.6 %, plasma RNA is far less sensitive than blood cells samples for the quantification of BCR-ABL transcripts.
Compared to plasma samples, blood cell samples produced significantly higher (p < 0.05) levels of BCR-ABL transcripts at diagnosis and at different stages of treatment responses, and blood cell samples enabled sensitive detection of minimal residual disease. In addition, it was observed that in blood cell samples, there were significant differences (p < 0.05) of BCR-ABL/ABL transcript ratios among the four treatment response groups, suggesting the feasibility of using blood cell BCR-ABL/ABL transcript ratios for differentiating patients experiencing optimal treatment responses from patients experiencing suboptimal treatment responses. Therefore, it is evident that blood cell samples are a good source of RNA for the quantification of BCR-ABL gene expression. In contrast, patients with suboptimal treatment response could not be distinguished from patients with optimal response using plasma samples; therefore, plasma samples are not suitable for categorizing CML patients into different treatment response stages.
In blood cell samples, it was observed that BCR-ABL/ABL transcript ratios strongly correlated with patients’ white blood cell count values. Thus, the BCR-ABL transcript level in blood cells is indicative of the remaining tumor load in CML patients. As the BCR-ABL tumor load decreases to low or minimal levels, the patient’s white cell count normalizes, as observed in our results. An earlier study showed that there was no correlation between the concentration of mutated genes in plasma samples and tumor load. The reason was unclear, but it was postulated that plasma nucleic acids originate either from necrotic or from apoptotic cells and the underlying mechanisms need to be further explored [13].
A subsequent comprehensive study revealed that macrophages play an important role in the generation of plasma nucleic acids. The concentration of nucleic acids in the plasma is determined by the presence or absence of macrophages. In the absence of macrophages, necrotic cells or apoptotic cells do not produce plasma nucleic acids. However, co-occurrence of macrophages and necrotic or apoptotic cells leads to a spontaneous increase in levels of plasma nucleic acids [14]. Four stages are involved in the generation of free-circulating plasma nucleic acids: 1. recognition of necrotic or apoptotic cells by macrophages; 2. macrophage engulfment of necrotic or apoptotic cells; 3. digestion of necrotic or apoptotic cells; and 4. release of nucleic acids into the plasma [15].
In this study, our findings of extremely low levels of BCR-ABL transcripts in plasma samples of patients treated with TKIs are consistent with the hypothesis suggesting that no free-circulating plasma nucleic acid is produced in the absence of macrophages [16]. Imatinib mesylate was shown to inhibit the development and maturation of macrophages from bone marrow progenitors [17], as it blocks the functional capacity of interleukin-6 and tumor necrosis factor alpha resulting in the inhibition of macrophage maturation [18].
Nilotinib, another TKI similar to imatinib mesylate, also blocks the signaling pathway of macrophage-stimulating factor receptors and stops the production of macrophages [19]. Therefore, the results herein suggest that the low levels of BCR-ABL/ABL transcript ratios in plasma samples were possibly the side effects of TKI drugs in eliminating monocytes or macrophages in CML patients. Consequently, inadequate number of macrophages among patients receiving tyrosine kinase therapy would delay the clear-up process of dead BCR-ABL positive cells, and therefore, blood cells are the material ideal for quantifying BCR-ABL transcript concentration in CML patients receiving TKI treatment.
Limitations of the study
The scope of this study was limited to CML patients on TKI treatment. The inference from this study may not be applicable to CML patients on other types of anticancer drugs.
Conclusion
Plasma samples of CML patients on TKI therapy are not suitable for the quantification of BCR-ABL transcripts for treatment response monitoring. Blood cells are more sensitive for quantification assay of BCR-ABL transcripts and the values represent the amount of tumor load in untreated patients and patients on TKI therapy.
Declarations
Acknowledgement
References
Archives


News Updates